The correctness scores
It evaluates the quality of high-frequency information introduced by the SR model. Three correctness scores are implemented in opensr-test: improvement, omission, and hallucination. The correctness scores depend on the distance metric set by the user.
Each score reveals different aspects of the SR model performance:
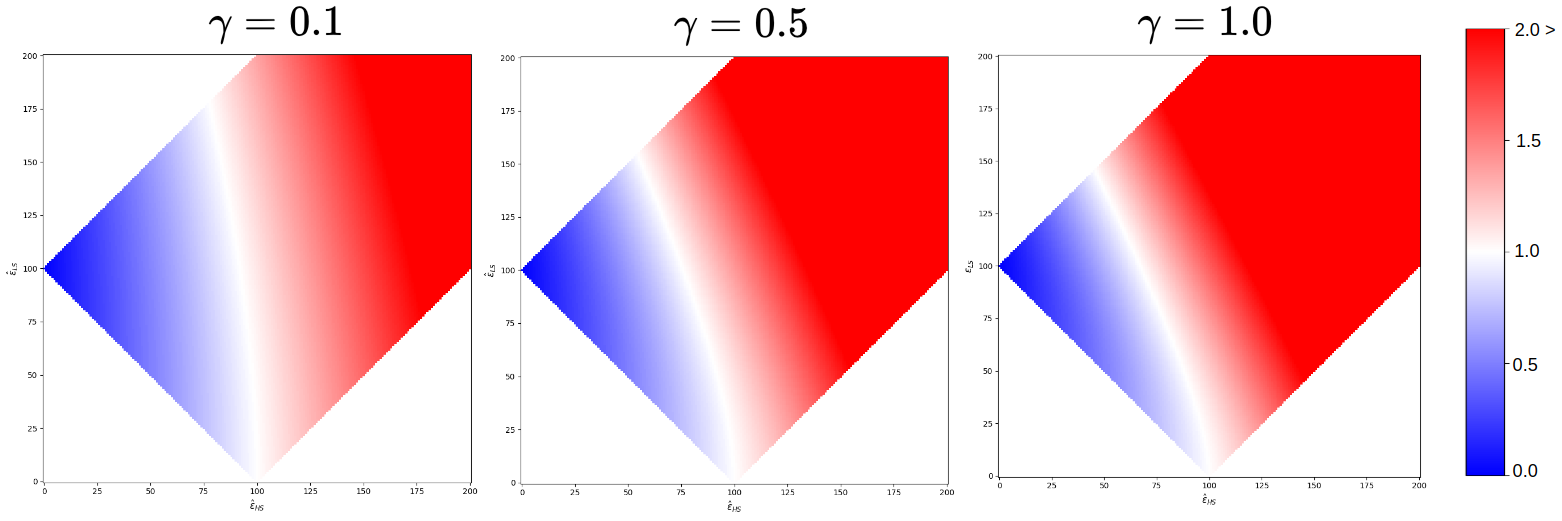
Improvement: Low values represent a good match between the SR and HR images. The equation for calculating improvement is:
\(H = d_{im} + d_{om} - 1\)
\(Improvement = d_{im} + d_{om}*(1 - e^{-\gamma H})\)
Where:
- \(d_{im}\) is the distance between the SR and HR images.
- \(d_{om}\) is the distance between the SR and LR images.
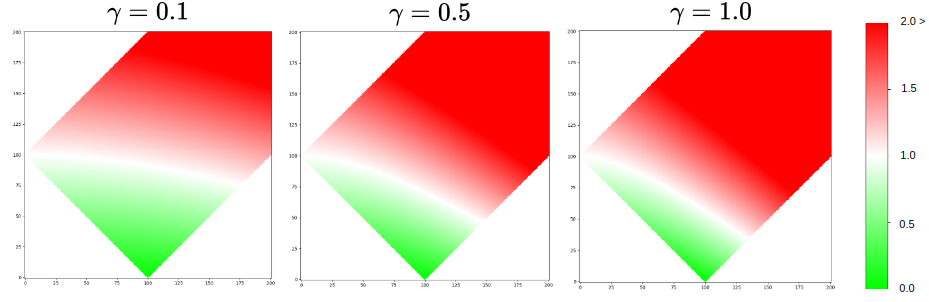
Omission: Low values are related to the inability to represent high-frequency information from the HR and keep similar to the LR image. The equation for calculating omission is:
\(H = d_{im} + d_{om} - 1\)
\(Omission = d_{om} + d_{im}*(1 - e^{-\gamma H})\)
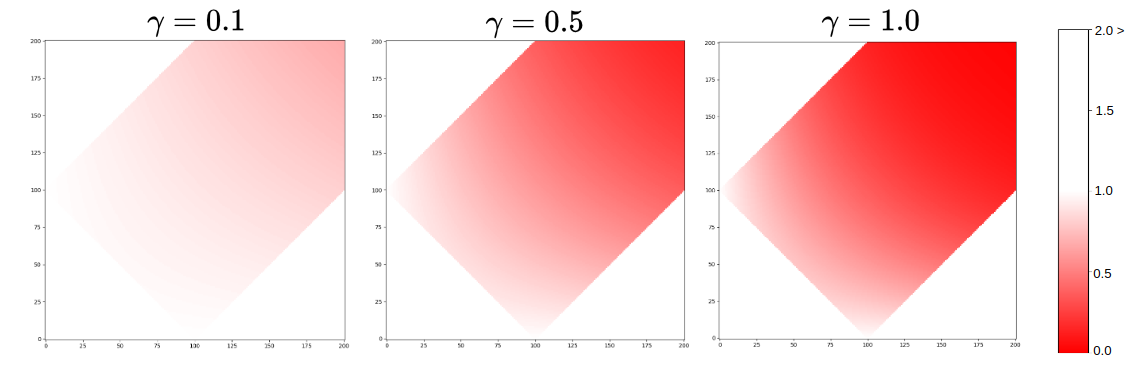
Hallucination: Low values shows the areas where the SR model has introduced high-frequency information that is not present in the HR image. The equation for calculating hallucination is:
\(Hallucination = e^{-\gamma * d_{om} * d_{im}}\)